
Drowning in Data: 3 Ways KPI Dashboards Cut Through the Noise
If your team is still pulling data from three different systems to build a monthly report, you already know the problem. Modern leaders face an avalanche of information pouring in from countless systems. Reports arrive constantly, spreadsheets grow in complexity, and teams struggle to determine which metrics require immediate attention. Business intelligence (BI) tools and operational & KPI dashboards can transform this chaos into clarity by consolidating metrics, visualizing trends, and providing actionable insights in real time.
Relying solely on spreadsheets or static reports forces teams to spend hours validating information instead of analyzing performance. Consolidated KPI dashboards provide a central view of key metrics and trends, allowing leaders to make decisions with confidence.
How KPI Dashboards Improve Visibility for Leaders
Dashboards simplify complex data by presenting the most relevant information in one place. Leaders gain visibility into operational performance, financial health, or risk indicators without toggling between systems. Data Visualization tools help teams quickly interpret changes and trends.
Finance teams gain clarity on cash flow patterns, operations managers gain real-time visibility into project timelines and resource allocation, IT monitors system performance, and internal audit identifies potential compliance issues earlier.
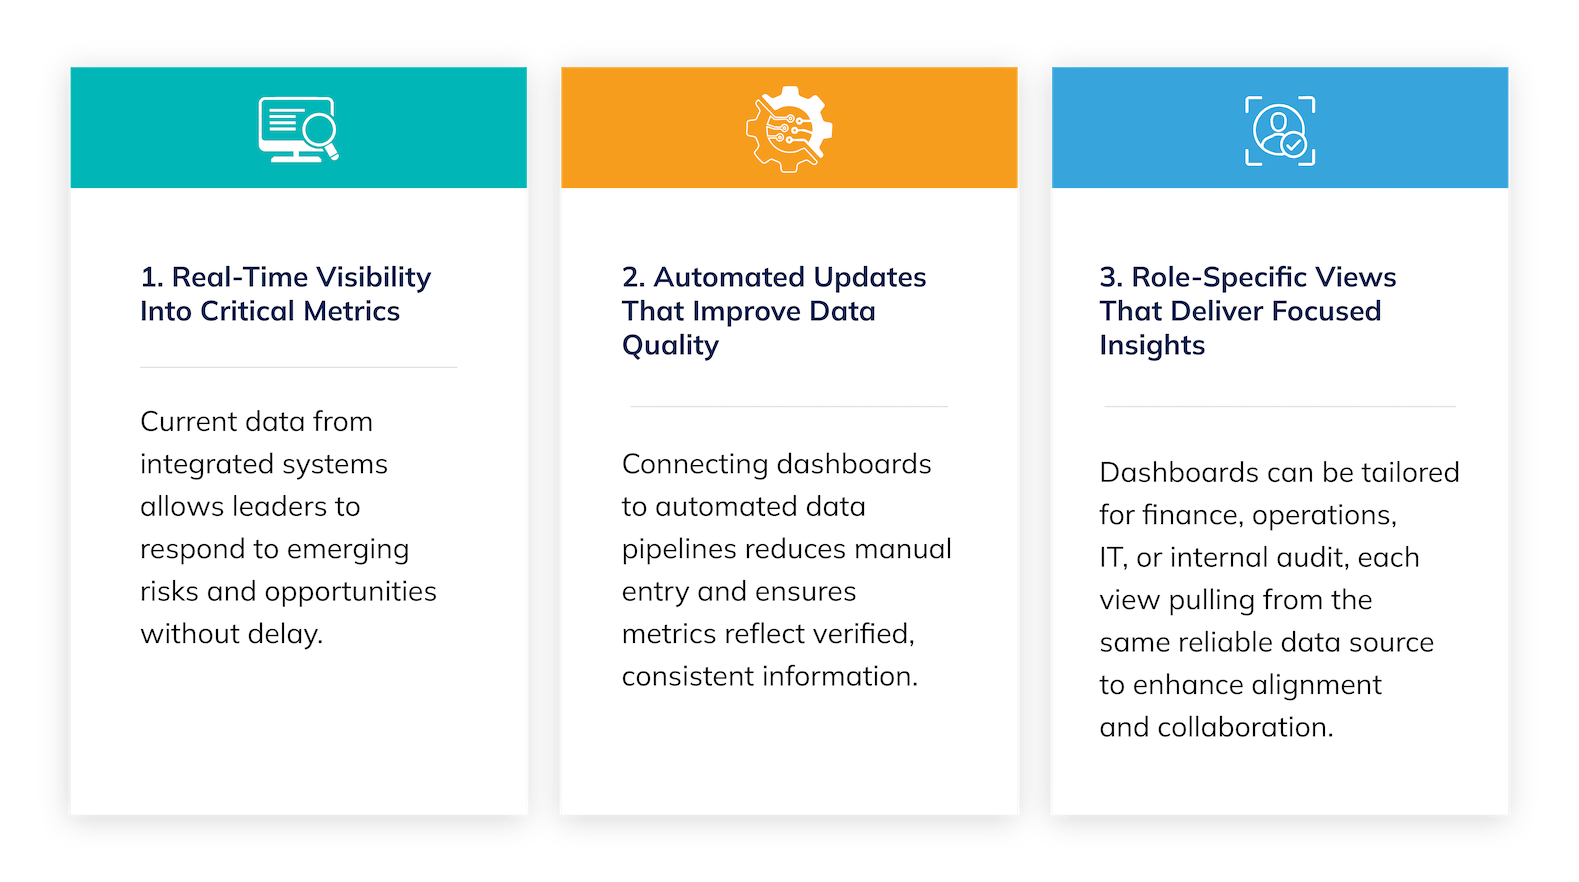
Three KPI Dashboard Capabilities That Improve Data Clarity
Why KPI Dashboards Enhance Decision-Making
Dashboards reveal the root causes of performance issues and support proactive data-driven decision-making. Whether surfaced through an executive dashboard or an operational view, these insights help teams plan more effectively, manage risks, and operate efficiently without chasing down outdated data. Collaboration improves because everyone works from consistent information. KPI dashboards also support audit readiness by providing validated, documented metrics.
Build a Smarter Data Strategy Through KPI Dashboards and Business Intelligence
Clark Schaefer Consulting helps organizations design KPI dashboards and business intelligence solutions, including Power BI, that surface the right insights at the right time. Our team integrates ERP and other data pipelines, builds role-based self-service analytics views, and ensures leaders can make informed, data-driven decisions. Contact our Data Analytics team to see what a dashboard built around your KPIs could look like.
Expert Contributors